Unit 3. Digital marketing metrics and analytic
This report will examine explain the stages of the sales funnel, Identify industry benchmarks, a range of factors on sales funnel conversion rates, and understand how the metrics of digital marketing are generated, importance of statistically significant data, the tools used for generating tracking data, how to add tracking tools to a campaign, how tracking data is viewed. This report will also look at the KFC ‘Clean Eating’ Burger Case study where KFC wanted to create a mass awareness of its Louisiana burger. This was during a time when the nation’s obsession with healthy eating had reached fever pitch. The fast food chain worked with agency BBH to challenge the indifference the audience had displayed towards previous social campaigns.
Unit 3.1 Understand the sales funnel in digital marketing
1.1 Explain the paths to conversion through stages of the sales funnel.
The definition of the sales funnel (also known as a revenue funnel or sales process) refers to the buying process that companies lead customers through when purchasing products. A sales funnel is divided into several steps, which differ depending on the particular sales model. One common sales process is divided into seven phases including:
- Awareness Phase – in which prospects become aware of the existence of a solution.
- Interest Phase – in which prospects demonstrate interest in a product by conducting product research.
- Evaluation Phase – in which prospects or prospect companies examine competitors’ solutions as they inch toward a final buying decision.
- Decision Phase – In which a final decision is reached and negotiation begins.
- Purchase Phase – in which goods or services are purchased.
- Reevaluation Phase – in B2B sales it’s common for offerings to involve contracts that need to be renewed. As a customer becomes familiar with an offering, and especially as a contract draws to a close, a customer will enter a reevaluation phase during which they’ll decide whether or not to renew their contract.
- Repurchase Phase – in which a customer repurchases a product or service.
Inside sales managers commonly adopt strategies, tools and tactics aimed at optimising each stage of their sales process.
We can recognise a few stages of the sales funnel. Two of them, awareness and consideration are on the top of the funnel. Awareness is when the prospect has just found your company by some means and is learning what you’re about. A marketing funnel can be considered as goals set by a marketer to turn a name into a “brand”, which begins with making people aware of its existence. Consideration is an important stage as it sets the foundation for the following stages. A brand needs to first lay the brick of recognition before going after sales. You can create blog posts, videos, or offer educational e-books. Whichever method you choose, your focus needs to lie on educating the audience and making them curious to know more about your brand. Conversion is the next stage of the sales funnel where brand need to build a relationship with them and tell them about own products, how to use them and how they are better than other products on the market. The best way to do this is through targeting advertisements, provide product explained videos, case studies, info-graphics, and how to or tutorial videos. You need to do everything in your power to convince these potential customers to trust your brand.

1.2 Identify the industry benchmarks for conversion rates for different stages in the sales funnel.
What does industry benchmark stand for? How we can measure industry benchmark? What tools we can use, in relation B2B, to measure different stages in the funnel panel?
About those and many other questions, marketing teams need to think every day to improve the company status “we are the best”.

Benchmarking will point out what changes will make the most difference, but it’s up to you to actually put them in place. Here are a few steps in this process:
- Choose a product, service, or internal department to benchmark
- Determine which best-in-class companies you should benchmark against – which organisations you’ll compare your business to
- Gather information on their internal performance, or metrics
- Compare the data from both organisations to identify gaps in your company’s performance
- Adopt the processes and policies in place within the best-in-class performers
Here are definitions of conversion by lead stages:
- Impression – an impression from an ad, booth, article or other marketing effort
- Website Visit – a unique visitor to the website (may be anonymous)
- Inquiry – a raw response to a program (webinar registrant, booth visitor, etc.) where contact info is obtained, but little else is known about the lead
- Marketing Qualified Lead (MQL) – a lead that meets specific pre-determined qualification criteria such as company size, industry, role of lead, frequency of visits, specific pages visited, etc.
- Sales Accepted Lead (SAL) – a lead formally accepted by sales, and upon which sales is compelled to work in a given time frame
- Sales Qualified Lead (SQL) – a lead that has evolved into a qualified pipeline opportunity
- Win – closed business
https://www.shopify.co.uk/encyclopedia/benchmarking
1.3 Evaluate the effects of a range of factors on sales funnel conversion rates.
Knowing conversion rate(s) of your business is a first step in understanding how your sales funnel is performing and what marketing avenues are giving the greatest return on investment (ROI).
The following are some factors that affect the conversion rate of a website:
- Elements modified: The elements you modify in a test page impact its conversion rate. Be sure to select elements that are most prominent in the test page. If you modify less significant elements such as footer, you may not notice much improvement in the conversion rate.
- Difference in variations: You may notice a significant difference in conversions if variations are drastically different from the control version of the test pages. If changes in the variations are minor such as increasing the font size, the difference in the conversions rate could be minimal.
- Number of variations: Larger the number of variations, higher the chances of coming up with a winner. However, having a large number of variations requires you to run the campaign for a longer duration.
https://venturi-web-design.com/calculate-sales-conversion-rate/
Unit 3.2 Understand how metrics of digital marketing are generated.

2.1 Explain the data required to evaluate success Key Performance Indicators (KPIs)

Digital Marketing Metrics and KPIs are values used by marketing teams to measure and track the performance of their marketing campaigns. Digital marketing teams use a number of tools to promote their services and products, and tracking the results can often be time consuming and difficult. By creating specific digital marketing KPIs, it’s easy to determine targets and goals and measure performance based on those values.
https://www.klipfolio.com/resources/kpi-examples/digital-marketing
Traffic Metrics
These metrics are primarily measured and monitoring during the traffic generation stage and are very important for both Search Engine Optimisation (SEO) and Pay-Per-Click (PPC) digital marketing techniques.
- Overall Site Traffic
Significant changes in how traffic flows to your site can give you an insight on how effective a particular digital marketing technique initiated is effective or not. When measuring site traffic, don’t just focus or rely on page views or the number of hits your website gets but also on how many unique visitors your website get per week or per month. The more unique visitors your website receives, the greater the chances of getting potential customers.
- Traffic Sources
Knowing where your site traffic is coming from and what particular sets of keywords brought them there can give you an insight as to what keywords or keyword phrases you should focus more on your digital marketing campaigns. Search engines still proved to be the primary source of website traffic according to various studies, but you can also leverage on other traffic sources that may prove beneficial for your business.
- Mobile Traffic
Mobile internet is proving to be a strong digital marketing arena as more and more people across the globe access the internet through their smartphones and other internet-capable mobile devices. This deserves much more attention from digital marketers as these can open new doors for greater and more diverse revenue sources. This metric can also provide and insight on how business owners can effectively structure and plan their content – resulting in better engagement with both mobile and non-mobile website visitors.
- Click Through Rate (CTR)
Pay-Per-Click (PPC) are viable sources for targeted traffic and can be measured effectively by the figuring out the number of clicks your PPC ads receive based on the total number of impressions. Each time your ad is viewed an “impression” is made and Click Through Rates (CTR) measure how many people actually clicked on your Ads. The higher the CTR, the better your Quality Scores will be, allowing you to lower your PPC costs by receiving pricing discounts from Search Engine Marketing platforms like Google Adwords.
- Cost Per Click (CPC)
The Cost Per Click (CPC) defines how much you are going to pay the search marketing platform every time an internet user clicks on your PPC Ad. This value will vary depending on how popular your chosen keyword or keyword phrases are, your Quality Score as influenced by Click Through Rates (CTR), and the standard prices search engines initially set. You can set the CPC budget for keywords, keyword phrases and categories individually or all at once.
Conversion Metrics

As discussed in earlier Digital Marketing Philippines articles, converting website traffic into business leads or outright sales is the primary purpose for your digital marketing campaign. This goal should be at the core of your digital marketing efforts, with the following providing insights as to what particular metrics are important during conversion.
- Conversion Rate (CVR)
Measuring how many website visitors actually gets converted into leads or sale is a valuable and tangible metric that defines your digital marketing success. Whether your goal is to gather valuable information about your website visitors and potential customers, or convert site visits into sales, monitoring your Conversion Rates can give you a great insight as to what particular aspects in your digital marketing campaign will deliver the best results.
- Cost Per Lead (CPL)
The success of a digital marketing campaign depends on how well your website and content convert website traffic into leads or paying customers at minimal possible costs. Cost Per Lead (CPL) is a metric that defines the lead conversion ratio of a particular campaign and corresponding cost, giving insights to the business owner or marketer on how profitable their campaign is or not.
- Bounce Rate
Not all website traffic to your site can be converted into leads or sales, or stay longer immersed in your web pages and partaking of your website content. On some of these visits, site visitors immediately leave or “bounce” as fast as they arrive – should they find your content irrelevant to their needs. Knowing bounce rates can provide you insights on how you could better improve or optimise your content.
- Average Page Views per Visit
Driving good traffic to your website is one of the most important and foremost components in your digital marketing campaign, and how well you can entice them to stay longer on your web pages and digest your content. The more page views generated from each visit the more chances for engagement with website visitors, eventually influencing them to get converted into leads or paying customers.
- Average Cost per Page View
The amount of investment poured into a paid digital marketing channel like PPC can be controlled by knowing the average cost per page view and the amount of revenue you can generate from a particular page. Your cost per page view should be significantly lower than the revenue you can generate from the page in order to gain profit from your campaigns.
- Average Time on Site
You can measure how well you are engaging with your targeted website visitors by how long their average times during each visit to your site is. This is important for gauging what content is relevant and would drive results from site visitors, gaining their valuable trust, and eventually increase these levels of trust into something that would finally entice them to convert.
- Rate of Return Visitors
Website popularity is not only defined by the amount of traffic your site is generating, but also by the rate of return visitors that keep coming back to partake more of what you can showcase with your content. Knowing your Rate of Return Visitors can give you an insight on how you can improve your content to entice site visitors who have not converted yet as leads or paying customers – to finally do so.
Revenue Metrics
Ultimately, the success of your digital marketing campaign can be measured properly by revenue metrics. These will tell you if a particular campaign is profitable or not so you can make adjustments on how you can improve your content for better engagement, higher conversion and bigger revenues.
- Return On Investment (ROI)
The Return on Investment (ROI) can be aptly measured by website traffic that are eventually converted into new paying customers. This metric will also help you identify which area in your digital marketing campaign is driving sales and revenue, and which areas should be given more room for improvement.
- Cost to Acquire a Customer (CAC)
ROI is measured by the number of new paying customers for a given time period. The cost for acquiring these new customers on the other hand is defined by getting the total of your marketing and advertising costs for a particular time period divided by how many new paying customers were generated during that same period. Although calculations may not be that perfect, CAC can give you with good insight on how effective and successful your digital marketing campaigns can be.
2.2 Explain the importance of statistically significant data

Statistical significance is a way of mathematically proving that a certain statistic is reliable. When you make decisions based on the results of experiments that you’re running, you will want to make sure that a relationship actually exists.
Online web owners, marketers, and advertisers have recently become interested in making sure their a/b test experiments (eg. conversion rate a/b testing, ad copy changes, email subject line tweaks) get statistical significance before jumping to conclusions.
Your statistical significance level reflects your risk tolerance and confidence level. For example, if you run an A/B testing experiment with a significance level of 95%, this means that if you determine a winner, you can be 95% confident that the observed results are real and not an error caused by randomness. It also means that there is a 5% chance that you could be wrong.
Why Is Statistical Significance Important for Business?
Statistical significance is important because it gives you confidence that the changes you make to your website or app actually have a positive impact on your conversion rate and other metrics. Your metrics and numbers can fluctuate wildly from day to day, and statistical analysis provides a sound mathematical foundation for making business decisions and eliminating false positives.
A statistically significant result isn’t attributed to chance and depends on two key variables: sample size and effect size.
Sample size refers to how large the sample for your experiment is. The larger your sample size, the more confident you can be in the result of the experiment (assuming that it is a randomised sample). If you are running tests on a website, the more traffic your site receives, the sooner you will have a large enough data set to determine if there are statistically significant results. You will run into sampling errors if your sample size is too low.
Effect size refers to the size of the difference in results between the two sample sets and indicates practical significance. If there is a small effect size (say a 0.1% increase in conversion rate) you will need a very large sample size to determine whether that difference is significant or just due to chance. However, if you observe a very large effect on your numbers, you will be able to validate it with a smaller sample size to a higher degree of confidence.
Beyond these two factors, a key thing to keep in mind is the importance of randomised sampling. If traffic to a website is split evenly between two pages but the sampling isn’t random, it can introduce errors due differences in behaviour of the sampled population.
For example, if 100 people visit a website and all the men are shown one version of a page and all the women are shown a different version, then a comparison between the two is not possible, even if the traffic is split 50-50, because the difference in demographics could introduce variations in the data. A truly random sample is needed to determine that the result of the experiment is statistically significant.
In the pharmaceutical industry, researchers use statistical test results from clinical trials to evaluate new drugs. Research findings from significance testing indicates drug effectiveness which can drive investor funding and make or break a product.
Easily Calculate Statistical Significance with Stats Engine
Calculating statistical significance accurately can be a complicated task that requires a solid understanding of statistics and calculus.
Fortunately, you can easily determine the statistical significance of experiments, without any maths, using Stats Engine, the advanced statistical model built-in to Optimally.
Stats Engine operates by combining sequential testing and false discovery rate control signs to deliver statistically significant results regardless of sample size. Updating in real time, Stats Engine will ensure a 95% significance level results every time, boosting your confidence in making the right decision for your company and to avoid pitfalls along the way.
To address these common problems, Stats Engine was created to test more in less time. By helping you make statistically sound decisions in real time, Stats Engine adjusts values as needed and shares trustworthy results quickly and accurately.
Start running your tests with Optimally today and be confident in your decisions.

https://www.optimizely.com/optimization-glossary/statistical-significance/
2.3 Explain the tools used for generating tracking data

Different analytics produce different data, but the underlying goal is the same: to measure the performance of your web presence. We’ve divided the metrics into four different areas of focus, with two tools in each area, thus recommending eight tools you should be using:
Social metrics
- Facebook Page Insights: This is a free, built-in feature available for your company’s Facebook page. It can be used to see whom your posts are reaching, who’s liking your posts, and where your visitors are coming from. You can also see data on how your page’s performance is trending over time and how visitors are engaging with your content. With this information, you’re able to optimise your social presence in order to increase likes, followers, and shares.
- Twitter Analytics: Another free social tracking tool, and you don’t even need to be advertising on Twitter to use it. Use this to learn more about who your followers are, where they are coming from, and what topics they find interesting. This tool measures engagement to show you which tweets are reaching the most people and how to make your content more successful.
Testing/optimizing
- Optimally: This platform provides companies with a simple solution to improving website pages through A/B testing. With this tool, you can easily make changes to a page on your site and test it to see if your new version is better than the old page. Use this to figure out how to make a successful website and achieve performance goals. The best part about this tool is that you don’t need any coding experience.
- Google Content Experiments: This is another free tool from Google that helps you test and choose between different versions of your website or landing pages. Find out which parts of your page or content generate the most clicks or conversions. This tool then measures how each page performed and shows you which is the most effective. Once you’ve found your highest-converting page, you can publish it to be live for all visitors.
SEO/competitive intelligence
- Moz: This SEO tool set is perfect for tracking and improving your search engine rankings, as well as tracking your competitors’ rankings. With Moz, you can track keywords by campaign or location, see how you rank on both desktop and mobile devices, find out who your top competitors are, and much more—all in one package. This is a great tool that can help optimise your site and improve your rank.
- SEMrush: This is another great tool to compare your performance with your competition. Perfect for those companies that advertise on Google or other search engines. This tool shows how you rank among your competitors and even lets you see information such as copy, keywords, and budget. Along with these features and tools, you’ll gain valuable insight and recommendations that will help you improve your website’s performance, ranking, and advertising.
User behavior
- Google Analytics: One of the best and preferred analytics tools available—and the best part is, it’s free. Google Analytics tracks web traffic to your site and collects data, such as keywords, that can be used to help improve your visitors’ online experience. Find out which keywords are bringing in the most visitors to your site. Get reports and information about your visitors and your conversions. Figure out where you might be losing visitors and why so that you can improve those pages and keep them from leaving.
- Crazy Egg: Want to learn more about how your visitors navigate your site? This tool shows you just that. With easy-to-follow heatmaps, overlays, and other visualisations, you can see exactly what your customers are doing on your page. Crazy Egg shows you where people are and are not clicking, how far down the page they’re scrolling, their mouse movements, and more. This is a great tool for helping improve your site’s design and content by seeing what your visitors find most interesting or useful. You’ll get information on where people are coming from and which areas of your site are catching their attention.
General Data Comparisons and Visualization
- Databox: A favorite of the SmartBug team, Databox is an excellent way to extend your reporting abilities from HubSpot and many of the other tools we’ve listed in this post. Databox’s dashboards, built-in goal tracking and comparison features, and ability to integrate multiple data sources make it a no-brainer for companies who want to keep a close eye on performance.
https://www.smartbugmedia.com/blog/8-website-analytics-tools-you-should-be-using
2.4 How to add tracking tools to a campaign
How to track your campaigns?
We’re using Google Analytics here as it’s so popular, but other analytics tools will have similar features.
When a visitor lands on your website, Google Analytics records that pageview along with the source and medium that the visitor originated from. The “source” is the domain that the visitor came from, and the “medium” is a classification for different kinds of traffic. There is also a “campaign” parameter that can be used to further segment your traffic.
Many tools like MailChimp, Hootsuite, Oktopost and Hubspot have features that let you create tracking URLs, but anyone can use Google’s own Tracking URL Builder. You can automatically apply tracking parameters to all Adwords traffic by enabling Auto-tagging in Adwords (read instructions about how it works.).
A simple URL looks like this: http://qoints.com
A Tracking URL looks like this: http://qoints.com/?utm_source=smartinsights.com&utm_medium=referral&utm_campaign=guestpost
These UTM parameters (everything after the “?”) force Google Analytics to record this data into the visitor’s pageview. In your Analytics Reporting view, under Acquisition > All Traffic, you will see traffic from the above Tracking URL as:
source / medium = newsletter / email
and in the Acquisition > Campaigns report you’ll see this traffic under Campaign = agency-newsletter
Using Tracking URLs for the campaign promotion example above, we’d get this:
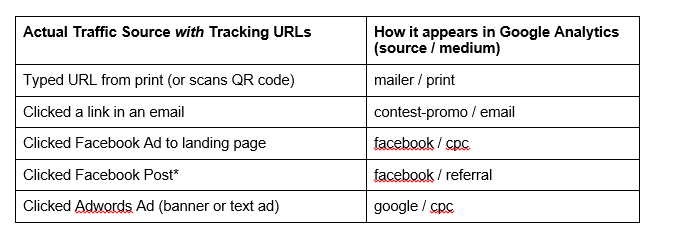
* using a simple URL when posting links to Facebook will report people who click the link as facebook / referral by default, but you can use UTM parameters to distinguish different campaigns if you want
The URLs below all go to the same fictitious landing page (http://example.com/), but they have different tracking parameters appended to them:
1. http://example.com/?utm_source=mailer&utm_medium=print&utm_campaign=agencies
2. http://example.com/?utm_source=contest-promo&utm_medium=email&utm_campaign=agencies
3. http://example.com/?utm_source=facebook&utm_medium=cpc&utm_campaign=agencies
4. http://example.com/?utm_source=facebook&utm_medium=referral&utm_campaign=agencies
5. http://example.com/?utm_source=google&utm_medium=cpc&utm_campaign=agencies

2.5 How to tracking data is viewed.

Conversions
Conversions occur when visitors or customers take specific actions as a result of your digital marketing. Unlike website behaviour, conversions are more directly linked to sales and revenues. Since your ultimate goal is increasing profits, making sure your digital marketing converts is absolutely essential.
Here are five types of conversions that can indicate successful campaigns:
#1. Online sales
Online sales from your website is perhaps the simplest conversion for gauging success. Tracking your online sales is easy if you use Google Analytics or another Web analytics platform.
After installing a small snippet of code on your website, you’ll be able to see which of your campaigns are driving the most online sales. This is the most important conversion for strictly e-commerce business owners.
#2: Online-to-store sales
Not everyone who finds your business online will buy from your website. Local customers are likely to visit your store and make in-person purchases. How do you measure these conversions?
Don’t worry, there are ways to gauge online-to-store sales.
For example, you can collect information from prospective customers on your website, such as email addresses, that can later be compared with data collected at the cash register. Or, you can offer a special discount code on your website so when customers redeem the discount you’ll be able to easily match it back to the marketing campaign.
Or, you can be really low tech and just ask customers whether they found your business online. Clarify how they found you – such as via a PPC ad, Facebook or a Google search — and record their answers in a spreadsheet. Then you can see which campaigns drive more in-store conversions.
#3: Leads from Web forms
Most websites have forms that customers can use to request services, schedule appointments or get more information. If you’re using Google Analytics, you’ll be able to see which campaigns result in the most use of your various Web forms.
Any visitor who completes a Web form to request a quote could later convert into a customer. Therefore, marketing campaign success can be measured by the number of leads (Web form submissions) generated.
#4: Leads and sales from phone calls
Tracking leads and sales from phone calls is also important for businesses that drive sales via the phone.
To track calls, you’ll need to set up dynamic number insertion (DNI), which shows visitors different phone numbers depending on how they arrived at your website. You can then view your phone logs to see which campaigns result in the most calls.
#5: Leads from live chats
Does your website offer live chat for visitors? If not, then you might consider adding it as another way to engage your visitors.
Once you have chat installed on your website, then you need to track which marketing campaigns are driving the most chats. This can be done using the built in tracking in your chat program or by integrating Google Analytics into your chat tool. In both cases, you’ll be able to see which campaigns are driving more leads for your business via live chat.
Now that we’ve covered 5 ways to measure conversions from digital marketing, it’s time to move on to tracking how visitors behave on your website. Just because a visitor doesn’t convert right away, doesn’t mean she’s never going to. For that reason, it’s not enough to only look at conversions. We must also review website behaviour metrics to measure digital marketing success…
Website Behaviour

Here are four ways to determine digital marketing success based on website behaviour:
#1: Website visits
This one is simple – which of your digital marketing campaigns are putting the most eyes on your website? Although this is a rather shallow metric compared to e-commerce and Web form conversions, it’s still important to measure visits per marketing channel.
This is especially helpful when you view the traffic trends over time. For example, you’ll want to measure traffic from Organic Search (SEO traffic) over time so you know if your SEO efforts are working. Plus, you’ll be able to spot potential problems early on if you see a sudden drop in SEO traffic.
#2: Page Views per visit
Website visits are important, but they don’t really indicate whether people are engaged by your business. What if nobody who visits your sites clicks around to your various products and pages?
Fortunately, Google Analytics can show you how visitors click through your site while also providing average numbers of page views per visit.
Pay close attention to which web pages your customers are visiting most. You might find that online customers are more attracted to certain aspects of your business or specific products in your inventory. If you’re promoting your blog, you can also get ideas about the topics your visitors find most interesting.
#3: Time spent on the website
How much time are people spending on your blog or website, and which of your digital marketing campaigns is bringing in the most engaged visitors?
Analytics can track this, too. Again, time spent on your website doesn’t directly lead to sales, but folks who spend more time browsing are more likely to later buy.
#4: Bounce rates
In the world of digital marketing, bouncing is bad for several reason.
If any of your campaigns have high bounce rates – meaning people hit their “back” buttons as soon as they land on your website – then there’s probably a serious disconnect between your marketing strategy and your landing page. Just as bad, though, Google might interpret websites with high bounce rates as low-quality or spam, resulting in an SEO penalty.
Use Google Analytics to measure your bounce rates over time to spot trends in each of your marketing campaigns.
2.1 Explain the data required to evaluate success Key Performance Indicators (KPIs).
Marketing KPIs, or key performance indicators, are specific metrics used to track and measure progress toward marketing goals. Each brand needs to compose their own the right KPIs for your marketing department’s specific needs and business goals is key to their effectiveness. Faster availability of data is a competitive issue for most organisations. For example, businesses which have higher operational/credit risk (involving for example credit cards or wealth management) may want weekly or even daily availability of KPI analysis, facilitated by appropriate IT systems and tools.
2.2 Explain the importance of statistically significant data.
Statistical significance is important because it gives you confidence that the changes you make to your website or app actually have a positive impact on your conversion rate and other metrics. Your metrics and numbers can fluctuate wildly from day-to-day, and statistical analysis provides a sound mathematical foundation for making business decisions and eliminating false positives.
2.3 Explain the tools used for generating tracking data.
Choosing the right marketing analytics tools, measuring your data correctly and optimising your marketing efforts by it, will make the difference between failing to reach your marketing goals features, strengths, and weaknesses. Make sure to choose the right set of tools that will help you understand your data and use it to boost your marketing results. These tools will help you track events, conversions, and your users’ behaviour. The most popular tools to track data are:
- Bugzilla
- FogBugz
- Trac Edgewall Software
- Numara Track-It!
- Mantis
- TestTrack Pro
- Team Foundation Server Item Tracking
- Remedy Action Request System BMC Software
- StarTeam Borland
- YouTrack JetBrains
- Zentrack
- Sourcegear
- ikiwiki
- iSupport GWI Software
- Kayako SupportSuite
- IBM Rational ClearQuest
- TestDirector
2.4 Demonstrate how to add tracking tools to a campaign.
Campaign tracking allows us to add tracking code to a URL so that visits coming through said link can be tracked. For example, if you look at the URL for the blog post, we’ll see that the following code has been added to the address.
2.5 Describe how tracking data is viewed.
The next step, after you’ve given your campaign time to generate some traffic, is to view the results in Google Analytics. This is so we can identify which placements within articles work best, which posts generate traffic, where to link to on the site, and so on. This is where link tracking, also known as UTM Parameters comes into play.
https://www.optimizely.com/optimization-glossary/statistical-significance/
/http://www.scmwise.com/software-tracking-tools.html
Unit 3.3 Understand the analytics of digital marketing
3.1 Explain how to customise analytics reporting technology for digital marketing campaigns.
Google Analytics (GA) is highly recommended as an indispensable tool for gathering data that will help you maximise your conversions. GA offers excellent reports that provide an overview of key metrics for a particular period, but the out-of-the-box reports won’t always fit your needs. GA also allows you to create your own reports.
Just click on “Customisation” at the top of the home page screen, and you’ll be able to set up a report that shows you whichever metrics you want to see, all in one page.

If you want to avoid the hassle of creating your own reports from scratch and instead leverage the work of some other great minds, you can head over to the Solutions Gallery and download any number of templates that might suit your purposes.
3.2 Demonstrate how to measure and analyse digital marketing campaigns
There are a few steps to measure and analyse digital marketing campaigns:
Step 1: What is the goal of the campaign/effort?
Each marketing campaign should have goal(s) with measurable outcomes that match long-term business or brand equity objectives. Being clear on this up front will save time and effort and will ensure that different elements of the campaign are doing their part to drive marketing metrics.
Step 2: Map your goals to marketing and campaign metrics
Marketing and sales folks often reference a traditional sales funnel to explain how someone learns about and makes purchasing decisions based on brand influence and preference.
Using a Sales/Marketing Funnel in alignment with your marketing objectives can help you:
- Drive awareness and favour ability at the top of the funnel (broad message and experiences to connect emotionally with LOTS of people – cultural relevance at scale)
- Drive consideration in the middle of the funnel (more focused and benefit-driven experiences targeted to a smaller number of people who have shown that they might be prospects)
- Drive purchase/lead-generation at the bottom of the funnel (call-to-action oriented message targeted to people who are in-market for the product and ready to buy
Step 3: Identify best tools to measure marketing efforts.
One of the most important jobs of a digital marketer is to stay up to date with current marketing trends and which includes a lot of blog and article reading. A simple list with popular tools:
SEO: Majestic SEO, Scribe, Moz.com, Raven Internet Marketing Tools, Inbound Writer, Zemanta
Blogger Outreach: Inky Bee, Buzz Stream, Group High
Social Media: Sprout Social, Hoot Suit
Analytics: Google Analytics, KISSmetrics, Link to Tally, Bitly
Monitoring: Trackur, Simply Measured, Social Mention, Ice Rocket, Meniton.net, Talkwalker Alerts
Project Management: Trello, Evernote, Google Calendar, WorkZone
Find Influencers: Klout, PeerIndex, Tap Influence, Traackr
Marketing Automation: Pardot, Eloqua, MarketoMail, Chimp, SendGrid
Content Promo: SlideShare,Whatfix.com, Gaggle AMP, Scoop.it, Triberr
Digital PR: Cision, Vocus
Mobile: Exact, Target, Heyo
Advocate and Loyalty Programs: Zuberance, Mogreet Express
Step 4: Setup and test your campaign steps.
At this point you should have the goal of your campaign, a metric you want to measure, and some idea of a tool that you’ll use. Now to brainstorm different types of marketing campaigns, if you haven’t already, and create assets, as well as the user experience you will need to run the campaign. If an advertising budget was set up when you identified the goal of your campaign, this is marketing spends can be added to help reach your objectives.
Campaign ideas could include a series of photos on Instagram that inspire viewers to take an action, short video ads that appear before watching a Youtube video, Facebook pay-per-click ads, or a contest giving away swag in exchange for an action by your audience. All of these efforts should be linked directly to the goal of your campaign and the metrics you are trying to track should be in alignment with that goal. Multiple campaigns could run simultaneously to achieve the same goal.

Step 5: Evaluate, analyse and provide recommendations.
If you’ve followed the previous four steps (have a clear goal, selected the metrics you’d like to evaluate, and selected a tool) the evaluation and analysis part should be relatively straightforward. This step can be complicated if you are examining results of a PPC campaign or counting Youtube views without your objectives defined. What would 40 versus 40,000 views mean on Youtube if you didn’t establish how that effort would impact your business objective or goal?
For reporting on your analytics, consider how often you’ll be asked to measure performance of campaigns like this in the future. If this is a regular reporting scenario for your efforts, consider a dashboard with key metrics pulled out to quickly explain your findings to others.

https://pace.oregonstate.edu/how-measure-and-analyse-digital-marketing-campaigns
3.3 Evaluate the methods for testing digital marketing campaigns
To improve your results, it is very important to take the time to regularly test your marketing campaigns and analyse the marketing metrics that matter (which include more than just the number of leads you receive from a campaign).
You need to understand the role that split testing can have when it comes to advertising, web pages, and email conversion rates, many haven’t thought about using the strategy on their content marketing campaigns. However, a split test can actually be utilised on many different types of situations in which it is preferable to optimise performance, including in content marketing.
Great way to test out your marketing campaigns, is to make use of social media sites like Twitter, Facebook, LinkedIn, and the like. For example, Twitter, with its limited character space, is the perfect place to test out email subject lines for your newsletters.

Use Twitter to Test Email Subject Lines
Use Facebook to Test Your Marketing Campaigns
Use YouTube to Test Video Creative
https://www.bizible.com/blog/measuring-marketing-campaigns
3.4 Recommend methods for optimising digital marketing campaigns
Optimisation and real-time seem to go hand in hand when thinking about advertising campaigns. It’s time to embrace the data and technology you have available, start optimising your digital advertising campaigns, and squeeze as much ROI (return on investment) from them as possible. Your business needs to optimise your digital advertising campaigns. Below you can find a few tips on how to optimise your campaign:
1. Focus on profit
Campaign A – generates a large volume of transactions at a high CTR ( click-through rate) and low CPC (cost per click)
Campaign B – generates a smaller volume of transactions at a lower CTR and higher CPC
2. From click to customer
Here are some basic steps you can take to start checking your user journey is tickety boo:
- What happens when the user clicks through from mobile, tablet or desktop? Are all the pages optimised for the relevant screen size?
- What does your landing page communicate above the fold? Do you have a clear call to action?
- How fast does your page load?
- If the customer abandons the process, what steps do you have in place, eg. re-marketing campaigns or abandon cart/form triggered emails?
- If they do become a customer, do you place them into an on boarding process to mitigate churn and stimulate activity?
3. Analytics
Creating a trading room floor mentality to campaign management is crucial to great optimisation, but to do this you need to have your analytic platform set up correctly. Ensure that you have the right analytics platform such as Google Analytics set up correctly and syncing with your own admin system. This will create accurate attribution and reporting of revenue figures against a respective campaign, channel (paid search, organic, email, social, etc), and source or medium.
4. Timing is everything
One of the key aspects of getting the timing right on a large-scale is understanding what events like school holidays, public holidays, sports, conferences, concerts and festivals might impact your business. Using the PredictHQ web app you can not only get event visibility across the world, you can also understand what events impact your business and when on average customers are most likely to buy relative to that event.
5. Understand who your target audience
Who are the customers that are buying your product or service? There’s no point trying to sell Sea World family holidays to a male student with no dependent and a penchant for beer. Use the intuitive platforms of today that come complete with a wealth of targeting options to help you zero in on the people you want to target and better-understand your audience, not just in the traditional sense of demographics but also their interests.
6. Landing pages
Having optimised landing pages is a crucial step in generating the best-performing campaigns. So much can be won or lost on your customer’s first click experience. Below are some quick tips about establishing a great landing page:
- Put content on the page which relates to your campaign to improve the quality score of your search campaign ads.
- Make the landing page relevant. For example, if a user is clicking or tapping on an ad send them to a localised landing page that contains elements including but not limited to:
- An image
- A title which includes the term company’s name
- Deals available from the company
- Localised content about hiring (which will also help with your quality score for Google AdWords campaigns).
7. Consistency
This is probably the easiest tip but something that is not often followed. What do we mean by consistency? It’s about ensuring that your potential customer has a familiar brand experience all the way through from seeing the hero image on the display ad, to it appearing on the landing page. The tone of voice, colours, logo, and other creative and visual cues you use should remain consistent all the way through the journey.
8. Abandonment
No matter what you do, there will be times when certain users abandon the process. Even worse is when these users become qualified leads and abandon at the point of signing up or transacting. To mitigate losing the cost spent in getting them to your landing page, try implementing abandonment tactics. This means if the user is either logged in or has completed an email field as part of the process but then abandons, you can trigger an email response.
9. A/B testing
What should you be A/B testing on your landing page? It could be anything from including a video on your homepage or not, through to simply changing the text on the main call to action button from ‘view now’ to ‘start free trial’. Whatever the tests are, we recommend testing each element in isolation, which means only having one A/B test running on the landing page at any given time.
10. Fail fast
There are myriad advertising platforms out there that promise the world but deliver very little. However, diversifying your advertising platforms is a great way of finding new channels that can deliver higher value ROI than the usual self-service advertising platforms of Google, Facebook, Twitter, LinkedIn, plus third-party players like Marin, Kenshoo, AdRoll, etc. Fortunately, if you implement most or all of the above, then you should be able to quickly identify which platforms deliver the most accurate targeting options and in turn generate optimal levels of conversion.
If a certain platform is not delivering the results you want, then you will have the ability to quickly assess and switch off. Likewise, if you find a platform that works for you then you can ramp up ad spend accordingly.
- If part of your business’ sales support is by phone, have a visible tap to call phone number when a customer views your website on mobile.
- Localise or localise (see what we did there?) your content depending on who you are targeting.
Case study: KFC spoofs vlogger trend with fake ‘Clean Eating’ Burger
In February 2017, KFC created an elaborate online prank to promote its latest Dirty Louisiana burger with a fake food blogger and a take on the clean eating craze.

The challenge
KFC UK & Ireland wanted to create mass awareness of its most indulgent burger yet- the Louisiana burger. This was during a time when the nation’s obsession with healthy eating had reached fever pitch.
Attitudes to Healthy Eating stated: ‘Signalling the UK’s booming healthy eating trend, 63% of adults try to eat healthy at least most of the time, up from 58% in 2015.’
The fast food chain worked with agency BBH to challenge the indifference much of the audience had displayed towards previous social campaigns.
Through the use of data BBH found an online phenomenon – “clean eating” – and uncovered an insight within that phenomenon: it is increasingly seen as joyless. With that in mind, KFC could join in and disrupt a highly relevant conversation its target audience was having.
The agency started by creating a KFC Crave Index. This looks at the total number of people ‘craving’ KFC on social media and divides it by the total branded conversation. The KFC Crave Index was showed a surge in the early months of 2017.
Almost 7% of the entire KFC conversation revolved around craving KFC. On further investigation, it became clear that people who were talking about ‘clean eating’ were the primary drivers.
The solution
BBH created not a fake burger, but also a fake food blogger: Figgy Poppleton-Rice with 40,000 fake followers. It created a presence for her on social platforms, as well as a fake book, and posted large amounts of content before the campaign started. This level of detail helped further the conversation and resulted in publications such as Marie Clare reaching out to ‘her’ for interviews. to launch a fake burger in collaboration with KFC.
BBH gave her a social presence on Instagram, Twitter and a blog. In keeping with other online influencer, it decided to invest £120 to increase her social credibility – garnering 40,000 followers across these channels.
Leading up to and throughout the campaign, Figgy would post endless ‘clean’ recipes. She also offered lots of dubious lifestyle tips and, in true Instagrammer-food blogger style, she had her own recipe book – “A Feast With Figgy”.

BBH followed this up with the launch of the KFC “clean-eating burger” a cauliflower bun, spiralised chicken, almond yogurt, ice-cube relish and other goodies.
Within 48 hours, the single image reached more than 12 million unique people in the UK, with just £5,000 media spend. Over 160,000 people had expressed their disgust about KFC’s latest burger.
In the same time frame, Figgy Poppleton-Rice became a superstar, accounting for 21% of all Google searches to do with “clean eating”.
Five days after the reveal, BBH the published the two-minute video showing Figgy the ‘clean burger’. The final reveal is a massive poster of the actual burger, the Dirty Louisiana, that comes down and smashes the Figgy’s burger.


KFC UK & Ireland

@KFC_UKI
Coming Monday: the #KFCcleaneating Burger – made in collaboration with @figgypop_rice
The results
The viral quickly became KFC’s most watched video ever, quickly racking up more than 10 million views, and reached more than one-third of the UK. Furthermore, over 250,000 people commented on the Facebook video alone.
The video received significant press coverage with news outlets all over the world and the campaign had a unique reach of more than 27.8 million globally.
The Dirty Louisiana became one of KFC’s bestselling LTOs (Limited Time Offers) of the past five years, selling out of 70% of stores nationally within three weeks and surpassing its sales mix target by 39%.
KFC even brought the burger back in July, marking one of the fastest returns of an ‘limited time offer’ product in KFC UK’s history.
The fake burger created a massive social conversation with 350,000 people mentioning the campaign – the majority in comments on the two Facebook videos.
The video generated more than 22 million views in total, which people collectively watched for 9.5 million minutes, meaning a watch-time of 18.5 years.
KFC owned 67% of the UK search interest in ‘clean eating’ over the course of the campaign spikes, according to Google data.Conclusion
